HOME PAGE * SEARCH * UK KS3 level Science Quizzes for students aged ~13-14

UK GCSE level BiologyChemistryPhysics ~14-16 * Advanced pre-university Chemistry ~16-18

GCSE Chemistry Notes: Describing & explaining methods of chromatography

Part 2b: GCSE level chemistry exam notes on mixture separation using chromatography analysis & chromatogram interpretation

[Author © Dr WP Brown PhD: Doc Brown's chemistry exam revision notes suitable for chemistry students studying AQA, Edexcel and OCR GCSE level chemistry courses & ~ US grades 9-10 chemistry, page updated Feb 6th 2026 *]

METHODS OF SEPARATING MIXTURES - using paper/thin layer chromatography, thin layer paper chromatography and gas chromatography and gas-liquid chromatography

PART 2b Methods of separating mixtures are described e.g. paper chromatography, thin layer chromatography, gc gas chromatography, glc gas-liquid chromatography

Remember, in the physical separation processes of paper chromatography and gas chromatography, no chemical reaction changes are involved, so no new substances are made.

(A) Paper chromatography and thin layer chromatography

(B) Gas chromatography and gas-liquid chromatography

(C) Key revision points on chromatography


diagram of paper/thin layer chromatography at the endMain sub-index for sections 1, 2a-2b and 3

Part 1 Definitions in Chemistry, Elements, Compounds & Mixture pictures & Physical & Chemical Changes

Part 2 Methods of Separating Mixtures of substances

Part 3 How to write equations, work out formula and name compounds

What next? Associated Pages

Alphabetical list of KEYWORDS for Parts 1-3: atom  *  balancing equations  *  centrifuges/centrifuging  *  chemical reaction/change  *  chromatography (paper/thin layer and theory) this page  *  compound  *  covalencycrystallisation  *  decanting/decantation  * displayed formula  *  distillation (simple or fractional)  *  element  *  equations  *  evaporation  *  filtration  *  formula  * gas chromatography  *  impure/pure  *  insoluble  *  ionic equations  *  ionic valence  *  iron-sulphur separation and heating experiment  *  magnet  *  mixture  *  molecule  *  naming compounds and ions  *  particle pictures of elements/compounds/mixtures  *  physical change  *  precipitation  *  products  *  pure substance  *  purification  *  reactants  *  sand/salt separation  *  separating funnel  *  separating mixtures  *  soluble/solution/solvent/solute  *  solvent extraction  *  symbols (for elements, formula, in equations)  *   state symbols  * working out formulae  *

(A) 2.3 Paper Chromatography or Thin Layer Chromatography

This method of separation is used to see what coloured materials make up e.g. a food dye analysis (e.g. smarties), separating the different coloured dyes in an ink e.g. felt tip pen inks.

Chromatography can be used to identify substances and check on the purity of a substance.

For example you could then investigate whether a pen ink is made up of one or more colours by paper chromatography.

The different food colourings in confectionary products e.g. in the icing top of a cake, the sugar coating on smarties etc. can all be separated and identified using paper chromatography.

The coloured material mixture to be separated e.g. a food dye (6 on the diagrams below) is dissolved in a solvent like ethanol ('alcohol') and carefully spotted onto chromatography paper or a thin layer of a white mineral material on a glass sheet (immobile or stationary phase). 

Alongside it are spotted known colours of pure dyes on the reference 'start line' (1-5), which is drawn in pencil so it doesn't 'run or smudge' - see the diagram below.

The paper is carefully dipped into the solvent (mobile phase) and suspended so the start line (baseline) is above the liquid solvent, otherwise all the spots would dissolve in the solvent!

The solvent is absorbed into the paper and rises up it as it soaks into the paper.

The solvent may be water (aqueous solvent) or an organic liquid non-aqueous solvent like an alcohol (e.g. ethanol, butanol) or a hydrocarbon (e.g. hexane).

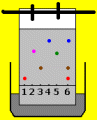
The technique and principles of how to do paper chromatography is illustrated below.

A DIAGRAM TO ILLUSTRATE the principles of PAPER CHROMATOGRAPHY
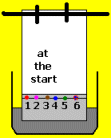
diagram of paper/thin layer chromatography at start diagram of paper/thin layer chromatography at the end diagram of paper/thin layer chromatography at the end diagram of paper/thin layer chromatography at the end

(a) At the start mark a baseline in pencil - this mark won't dissolve or run. Make sure it is above the surface of the solvent, so as not to dissolve the spots directly.

You then carefully put spots of the mixtures and standards (known materials) onto the baseline. so we start with an even line of solute chemical spots e.g. dyes or any coloured compound.

The prepared chromatogram paper is carefully placed in the solvent so the baseline and spots are above the solvent - and the solvent (grey) begins to move up the paper.

(b) As the solvent seeps into the paper and moves (spreads) up the paper it dissolves the ink spots and the colours begin to separate out.

It is best done in a larger covered beaker so the solvent doesn't evaporate into the laboratory!

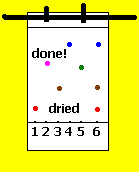
(c) When the solvent is near the top of the paper, the paper is removed and allowed to dry before examination and measurement of the Rf values of all the dyes. The final result is called the chromatogram.

If any of the dyes are insoluble in the solvent, they just stay on the start line and no analysis of them can be done.

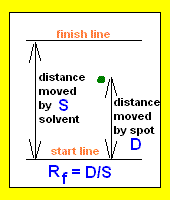
The 'finish line' is the highest point reached by the solvent front.

(d) How do we measure an Rf value from the resulting chromatogram? Its quite simple to measure a reference value ratio (Rf) for a dye colour.

e.g. for the green dye spot,

S might be 7.2 cm,

D might be 5.3 cm, so

Rf = D/S = 5.3/7.2 = 0.74

For best results:

(i) try different solvents eg water or ethanol ('alcohol'), propanone ('acetone') or butanol.

(ii) If you can enclose the whole system in a large glass container with a lid on.

This reduces evaporation of the solvent.

(iii) The fastest moving spots should be able to move at least 5 cm to get a reasonably accurate Rf value.

(iv) However, if any of the dyes are insoluble in the solvent, they just stay on the start line and no analysis of them can be done because there is no separation to make an Rf measurement (see below) to compare with known standard dye colours.

diagram of paper/thin layer chromatography at the endFor accurate work the distance moved by the solvent is marked on carefully with a pencil and the distances moved by each 'centre' of the coloured spots is also measured.

These can be compared with known substances BUT if so, the identical paper and solvent must be used (See Rf values below and diagrams above).

The Rf values is the ratio of how far the spot travels (D on diagram) relative to the distance moved by the solvent front (S on the diagram) and must have values of >0 and <1 to be of any use.

   distance moved by dissolved substance spot (D)
Rf  = ------------------------------------------------------------------------------
   distance moved by solvent front (S)

Each dye has its own reference values Rf for a particular set of experimental conditions

Chromatography Rf vales depend on the substance, the type of paper (stationary phase) AND the solvent (mobile phase).

To get consistent chromatography results you must use identical conditions, including temperature, and identical chemical reagents. These criteria is an example of 'fair testing' methodology.

You may have to experiment with solvents to ensure the best separation of the components for the most accurate analysis.

Generally speaking if spots match up, it shows what is present, if no matching spot, that dye wasn't present in the mixture.

However, (i) sometimes you get a match in one solvent and (ii) not another - this means (i) is a coincidence, because the reference dye and component mixture dye spots should match up whatever the component - need to think carefully about this point.


THEORY of thin layer/paper chromatography e.g. for a series of dyes

In chromatography the separation of the components in a mixture depends on their distribution between the mobile phase and the stationary phase.

Due to different solubility's of the coloured chemicals in the solvent AND different strength's of molecular 'adhesion' attraction to the paper, some colours move more than others up the paper faster, so effecting the separation of the different coloured molecules.

So the effectiveness of the separation depends on how soluble the chemical is in the solvent and how strongly the chemical is attracted to the paper.

Different solvents would be tested to see which was the most effective in separating the materials.

The distance the substance travels up the paper depends on:

(i) How soluble the substance is in the solvent - the mobile phase.

(ii) How strongly attracted the substance is to the paper - the stationary (immobile) phase - this is an intermolecular attraction.

Since these both differ from substance to substance, a separation takes place, the most soluble in the solvent or the least strongly attracted to the paper, will travel the farthest up the paper to give the largest Rf value.

Each solute dye is distributed between the paper and the solvent (the two phases) and there is constant movement of molecules between the stationary and mobile phases.

At any instant there is a dynamic equilibrium of dye concentration between the phases, meaning the number of dye molecules moving from the paper to the solvent equals those moving from the solvent to the paper.

Each dye has a different solubility and different strength of attraction to the paper - its all about interaction with the mobile solvent phase (ease of dissolving) and intermolecular attractive forces between the paper and the dye molecules.

However, if one dye is more strongly held by the paper (stationary phase), and the less soluble it is in the mobile phase solvent,  its progress up the paper is slowed down, hence the separation of the colours.

The final result is the vertical separation of the spots up the paper which is now referred to as the chromatogram.

diagram of paper/thin layer chromatography at the endAny colour which horizontally matches another is likely to be the same molecule i.e. red (1 and 6), brown (3 and 6) and blue (4 and 6) match, showing these three coloured substances are all in the food dye (6), the dye that's being analysed by paper chromatography.

In the diagram, think of dye (colouring) spots 1 to 5 as the known food dye colours, therefore food colouring dye 6 must be a mixture of three dyes, that is food colourings 1, 3 and 4 because these are the spots that line up horizontally with known standard samples. Dye 6 is composed of a mixture of red (1), brown (3) and blue (4) dyes.

Note that 1. to 5. give one spot each AND that's what you would expect for a pure compound. In fact it would be useless to have impure standards!

Suppose the solvent reached 8.0 cm from the baseline and for the coloured substances e.g

red spot 1.5 cm, Rf = 1.5/8.0 = 0.19;  green spot 4.5 cm,  Rf = 4.5/8.0 = 0.56;  blue spot 7.5 cm,  Rf = 7.5/8.0 = 0.94

The distance a substance moves, compared to the distance the solvent front moves (top of grey area on 2nd diagram) is called the reference or Rf value and has a value of 0.0 (not moved, not soluble, no good), to 1.0 (too soluble - no good either), but Rf ratio values between 0.1 and 0.9 can be useful for analysis and identification of coloured dye-like materials.

Rf = distance moved by dissolved substance (solute) / distance moved by solvent front

Rf values are used in many analytical situations to identify substances e.g. forensic science - analysing evidence samples, dye analysis in the food industry, food additives, testing for drugs, biochemistry e.g. analysing amino acids in a protein structure

Some technical terms: The substances (solutes) to be analysed must dissolve in the solvent, which is called the mobile phase because it moves. The paper or thin layer of material on which the separation takes place is called the stationary or immobile phase because it doesn't move.

It is possible to analyse colourless mixture of chemicals if the 'spots' can be made coloured by some further chemical or light treatment e.g.

(i) protein can be broken down into amino acids, separated with paper chromatography and coloured purple by a chemical reagent called Ninhydrin.

Each protein has its unique Rf value for a particular solvent.

(ii) Many colourless organic molecules fluoresce when ultra-violet light is shone on them, so the spots show up under uv light.

These extra reagents are called locating agents and enable Rf values to be measured and amino acids and lots of molecules to be identified.

If a substance is pure, only one spot will appear on the chromatogram, impurities may show up as other faint spots.

Thin layer chromatography (t.l.c, in chemistry, is not 'tender loving care'!) is where a layer of paste is thinly and evenly spread on e.g. a glass plate. The paste consists of the solid immobile phase like aluminium oxide dispersed in a liquid such as water (thick paste and dried out) or silica gel. The mobile phase or solvent is just the same as paper chromatography e.g. ethanol, other alcohol etc.

Important note: If the starting spot moves up the paper and remains as a single spot, it means that substance must be pure and not a mixture. If it was a mixture, then at least two spots would be seen.

Gas-liquid chromatography is further down this page.

For more on the chromatography of amino acids see:

GCSE notes AMINO ACIDS and natural polymers

Advanced A Level Notes Amino acids - molecular structure, preparation and reactions


A plant material extraction process using chromatography

The experiment described below simulates one way in which drug companies extract plant material to develop products in the pharmaceutical industry.

1. Take some suitable plant material and crush it with a pestle and mortar.

2. Scrape the crushed plant material and gently heat with a small volume of suitable solvent like water or alcohol to dissolve and extract some of the soluble coloured plant material.

3. Filter off the residue to give a clear but coloured concentrated solution.
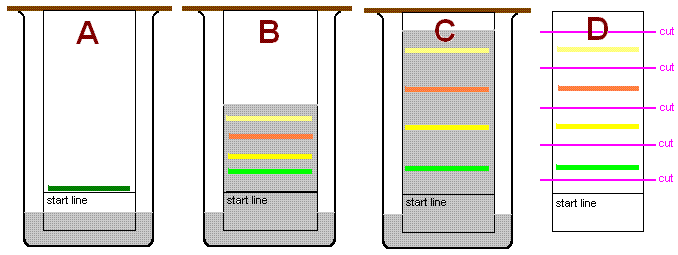
4. Take the solution and spread it along the start line of some chromatography paper (diagram A).

5. Dip and suspend the chromatography paper into a suitable solvent in a covered container so the start line is above the solvent surface and let the solvent be absorbed by the chromatography paper and move upwards (diagram B).

6. When the solvent front has reached near the top of the paper, stop  (diagram C) and hang up the chromatogram to dry.

7. You can then separate the mixture 'physically' by cutting strips off for each band of coloured material that has separated out on the chromatogram (diagram D).

8. You can then extract each separated product by re-dissolving it by placing the strips in the solvent.

9. The different solutions can then be carefully evaporated to produce the separated coloured solid materials.

Note: In practice in the pharmaceutical industry large scale thin layer chromatography would be used.
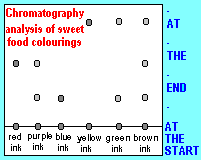

Another example of how to interpret a chromatogram where paper chromatography has been used to analyse coloured materials.

Lets assume we have pure red, blue and yellow dye molecules.

These three rise to different heights on the chromatograms.

Three different Rf reference values (yellow > red > blue).

By matching the spots horizontally, you can deduce:

(i) The purple ink contains red and blue dye molecules.

(ii) The green ink contains blue and yellow molecules.

(iii) The brown ink contains red, blue and yellow molecules.

TOP OF PAGE and sub-index

(B) GAS CHROMATOGRAPHY

  • Gas-liquid (GLC) or gas chromatography (GC) can be used to analyse liquid mixtures which can be vapourised (e.g. petrol, blood for alcohol content).

    • The instrument is called a gas chromatograph.

    • a picture of 'glc': diagram a gas chromatogram and the resulting chromatograph

    • A gas sample of the substance under investigation is injected and (if liquid) vapourised into a tube containing a carrier gas (called the mobile phase, it moves).

    • The mobile phase must be an inert or unreactive gas like nitrogen.

    • The gas carries the vaporised substance through a long 'separating' tube or column wound around inside a thermostated oven. Inside the column is the immobile phase (stationary phase) which is usually a thick viscous liquid/porous solid which has some affinity with the substances to be analysed in the carrier gas.

    • The substances in the mixture are partially absorbed by an absorbent material held in the or column (called the immobile phase or stationary phase, which doesn't move), but only temporarily. However different substances are held back, or 'retained', for different times so that the mixture separates out in the carrier gas stream.

      • There is a dynamic equilibrium of the component concentrations between the stationary and mobile phases.

      • The separation of the components of a mixture by chromatography depends on the distribution of the components in the sample between the mobile and stationary phases.

      • The more a substance is strongly held by intermolecular forces, the slower that component moves through the separating column (stationary phase). Therefore, depending on the different force of attraction, the components get separated out and emerge from the column into the detector at different times.

      • The column is filled with a porous solid so gas can get through but passes over a large surface area OR it is coated in a very high boiling organic liquid which can also provide a large absorbing surface but still allows gas flow.

    • The gases emerge from the oven into a detector system which electronically records the different signal as each substance comes through.

      • A printout or computer display of the results from the gas chromatograph, called the gas chromatogram, shows a series of peaks in the graph line imposed on a steady baseline when only the carrier gas is passing through the detector.

      • The time it takes for a substance to come through is called the retention time and is unique for each substance for a particular set of conditions (flow rate, length of separating column, nature of separating column material, temperature etc.).

    • Generally speaking, the greater the molecular mass of the mixture molecule, the longer the retention time.

      • This is because the component molecule - immobile phase intermolecular force of attraction increases with the size of the component molecule, so it is absorbed/retained temporarily a bit more strongly (see right of diagram).

    • The height of the peak, or more strictly speaking, the area under the peak, is proportional to the amount of that particular substance in the mixture.

    • Therefore it is possible to both identify components in a mixture and calculate their relative proportions.

    • The chromatogram shown above (right of chromatograph diagram) illustrates the separation of some alkane hydrocarbons in petrol (in reality it is far more complicated with dozens of hydrocarbon molecule peaks on the chromatogram). The different peak heights give the relative proportions i.e. hexane >pentane > heptane.

    • The retention time order follows the trend of increasing molecular mass gives increasing retention time i.e. in time heptane C7H16 > C6H14 > C5H12

    • The gas chromatographic instrument can be calibrated with known amounts of known substances.

      • So, the timing position of the peak identifies the component X in the gas and the height of the peak tells you much of X is in the mixture.

      • Note - if there is only one peak, only one substance has been detected. This may mean its a pure substance, or a substance containing molecules that cannot be detected by the particular gas chromatograph system.

TOP OF PAGE and sub-index


(C) Key revision points

on paper chromatography, thin‑layer chromatography (TLC), gas chromatography (GC), and gas–liquid chromatography (GLC)

aligned with the expectations of AQA, Edexcel, OCR Gateway, OCR 21st Century, WJEC, CCEA, and CIE Cambridge IGCSE Chemistry.

Everything is structured for GCSE/IGCSE exam preparation, with misconceptions and exam tips that examiners repeatedly highlight.


Paper Chromatography

Core idea of paper chromatography

A separation technique used to separate mixtures of soluble coloured substances (e.g., inks, dyes, food colourings).

How paper chromatography works

  • A spot of the mixture is placed on the baseline (pencil).

  • The paper is placed in a solvent (water or ethanol).

  • Solvent rises up the paper by capillary action.

  • Different substances travel at different speeds depending on:

    • Solubility in the solvent (more soluble → travels further)

    • Attraction to the paper (more attraction → travels less)

Key terms for paper chromatography

  • Stationary phase: the paper.

  • Mobile phase: the solvent.

  • Rf value:
    Rf = distance moved by substance / distance moved by solvent front
    Always less than 1.

Uses of paper chromatography

  • Identifying dyes in inks.

  • Testing purity (pure substances give one spot).

  • Comparing substances to known samples.


Thin‑Layer Chromatography (TLC)

What it is TLC

A more advanced form of chromatography using a thin layer of silica or alumina on a glass or plastic plate.

Key features of TLC

  • Stationary phase: silica/alumina.

  • Mobile phase: solvent.

  • More accurate, faster, and better separation than paper chromatography.

  • Rf values still used.

Why TLC separates

  • Different substances have different attractions to the stationary phase and different solubilities in the mobile phase.


Gas Chromatography (GC)

What it is gas chromatography

A technique used to separate volatile substances (substances that easily evaporate).

Key components of gas chromatography

  • Mobile phase: an inert carrier gas (e.g., helium or nitrogen).

  • Stationary phase: a solid or viscous liquid coated on the inside of a long column.

  • Detector: measures how long each substance takes to leave the column.

How gas chromatography works

  • Sample is vaporised.

  • Carried through the column by the gas.

  • Substances separate based on:

    • Boiling point (lower → leaves first)

    • Attraction to stationary phase (stronger attraction → slower)

Output

A chromatogram showing peaks:

  • Retention time: time taken for a substance to reach the detector.

  • Peak area: proportional to the amount of substance.


Gas–Liquid Chromatography (GLC)

(Often used interchangeably with GC at GCSE level)

What it is gas-liquid chromatography

A type of gas chromatography where the stationary phase is a liquid coated on a solid support inside the column.

Key points about gas-liquid chromatography

  • Same principles as GC.

  • Separation depends on solubility in the liquid stationary phase and boiling point.

  • Used in forensic science, environmental analysis, food testing.


Comparison Table of chromatography methods

Feature Paper Chromatography TLC Gas Chromatography Gas–Liquid Chromatography
State of mobile phase Liquid Liquid Gas Gas
State of stationary phase Paper Silica/alumina Solid or liquid Liquid on solid support
Typical use Dyes, inks Organic mixtures Volatile compounds Volatile organic compounds
Rf values? Yes Yes No (retention times instead) No (retention times instead)
Purity check One spot One spot One peak One peak

Typical Exam Bord Specification Content for chromatography

  • Paper chromatography practical and interpretation required.

  • Rf values required.

  • GC: retention times, peak areas, interpreting chromatograms, compound identification

  • Paper chromatography + Rf values.

  • TLC mentioned as alternative.

  • GC and GLC: interpreting chromatograms.

  • Chromatography principles.

  • GC: qualitative and quantitative interpretation.

  • GC: retention times, peak areas.


Typical Misconceptions about chromatography

X “The baseline should be drawn in pen.”

Correct: Use pencil – ink would dissolve and interfere.

X “The spots must be below the solvent front.”

Correct: Spots must be above the solvent level so they don’t dissolve directly into the solvent.

X “Rf values can be greater than 1.”

Correct: Rf values are always less than 1.

X “In GC, the biggest peak is always the substance with the highest boiling point.”

Correct: Peak area shows amount, not boiling point.

X “Retention time tells you the amount of substance.”

Correct: Retention time identifies the substance; peak area shows amount.

X “Paper chromatography only works for coloured substances.”

Correct: Colourless substances can be detected using locating agents or UV light (TLC).


Exam Tips for questions involving chromatography

Paper Chromatography

  • State clearly: stationary phase = paper, mobile phase = solvent.

  • Always mention capillary action and different solubilities.

  • When calculating Rf values, measure to the centre of the spot.

TLC

  • Mention silica/alumina as stationary phase.

  • Examiners like explanations involving attraction to stationary phase.

Gas Chromatography

  • Identify substances using retention times.

  • Determine amounts using peak areas.

  • The first peak is usually the substance with the lowest boiling point.

Chromatogram interpretation

  • More spots/peaks = mixture.

  • One spot/peak = pure substance.

  • If two substances have the same Rf value, they might be the same substance — but only if the same solvent was used.


A very concise summary of chromatography

  • Paper chromatography = Rf values.

  • TLC = silica/alumina plate.

  • GC = retention times + peak areas.

  • GLC = gas mobile phase + liquid stationary phase.

  • Purity = one spot or one peak.

  • Baseline in pencil.

  • Spots above solvent.

What next? Associated Pages

ALL my GCSE Level (~US grade 8-10) School Chemistry Notes (students aged ~14-16)

Find your GCSE science course for more help links to revision notes

ALL my Advanced Level pre-university Chemistry Notes (students aged ~17-18)

email doc brown

(c) doc b KS3 Science GCSE/IGCSE Chemistry States of Matter - particle theory of Gases, Liquids and Solids revision notes

(c) doc b KS3-GCSE/IGCSE Types of Chemical Reaction revision notes

(c) doc b GCSE/IGCSE Chemical Bonding revision notes (ionic, covalent, metallic etc.)

QUESTIONS:

GCSE balancing and completing equation exercises:

(1) multiple choice * (2) number/word multi-fill

GCSE 'name and formula' of a compound quizzes

(1) pick the name given the formula

(2) pick the formula given the chemical name

GCSE/IGCSE formula quiz given the name, type in the formula

GCSE/IGCSE name quiz given the formula, type in the name

KS3 Science-GCSE/IGCSE Elements, Compounds & Mixtures m/c QUIZ

KS3 Science-GCSE/IGCSE element name/symbol quiz


Based on the syllabus-specifications for students taking the IGCSE/GCSE level chemistry examinations summary revision notes and key points on how to do paper chromatography using Rf values for students taking the AQA igcse/gcse chemistry notes on how to do paper chromatography using Rf values, Edexcel gcse chemistry notes on how to do paper chromatography using Rf values,  OCR 21st century GCSE chemistry notes on how to do paper chromatography using Rf values, OCR gateway GCSE chemistry notes on how to do paper chromatography using Rf values, WJEC gcse chemistry notes on how to do paper chromatography using Rf values, CCEA gcse chemistry notes on how to do paper chromatography using Rf values for students taking CIE Cambridge igcse chemistry, or any other GCSE or IGCSE level chemistry exams notes on how to do paper chromatography using Rf values, useful for US grade 9-10 chemistry courses, Explaining the importance of diagram explaining gas liquid chromatography to analyse mixture in GCSE level chemistry, What you need to know about diagram explaining gas liquid chromatography to analyse mixture for GCSE level chemistry, Explaining the use of diagram explaining gas liquid chromatography to analyse mixture knowledge in GCSE level chemistry, Examples of diagram explaining gas liquid chromatography to analyse mixture explained when studying GCSE level chemistry, What is the significance of diagram explaining gas liquid chromatography to analyse mixture in GCSE level chemistry, describing and explaining the theory of diagram explaining gas liquid chromatography to analyse mixture when studying GCSE level chemistry, revision notes for diagram explaining gas liquid chromatography to analyse mixture in exams, online help for understanding diagram explaining gas liquid chromatography to analyse mixture, exam revision notes for diagram explaining gas liquid chromatography to analyse mixture, what do I need to learn about diagram explaining gas liquid chromatography to analyse mixture? revision summary for diagram explaining gas liquid chromatography to analyse mixture, learning notes for diagram explaining gas liquid chromatography to analyse mixture, help to pass the diagram explaining gas liquid chromatography to analyse mixture topic in an exam question, how to prepare for questions on diagram explaining gas liquid chromatography to analyse mixture in a GCSE chemistry examination?

Website content © Dr Phil Brown 2000+. All copyrights reserved on Doc Brown's Chemistry revision notes, images, quizzes, worksheets etc. Copying of website material is NOT permitted. Exam revision summaries & references to science course specifications are unofficial.

What next? Associated Pages

TOP OF PAGE and sub-index